Using the app
Charts
Tide charts — predicted vs observed, range, and share image.
Open a station → Chart. Levels are typically shown relative to MLLW — a zero line, not “feet of water under the boat.” See MLLW, NAVD88, and what the numbers mean.
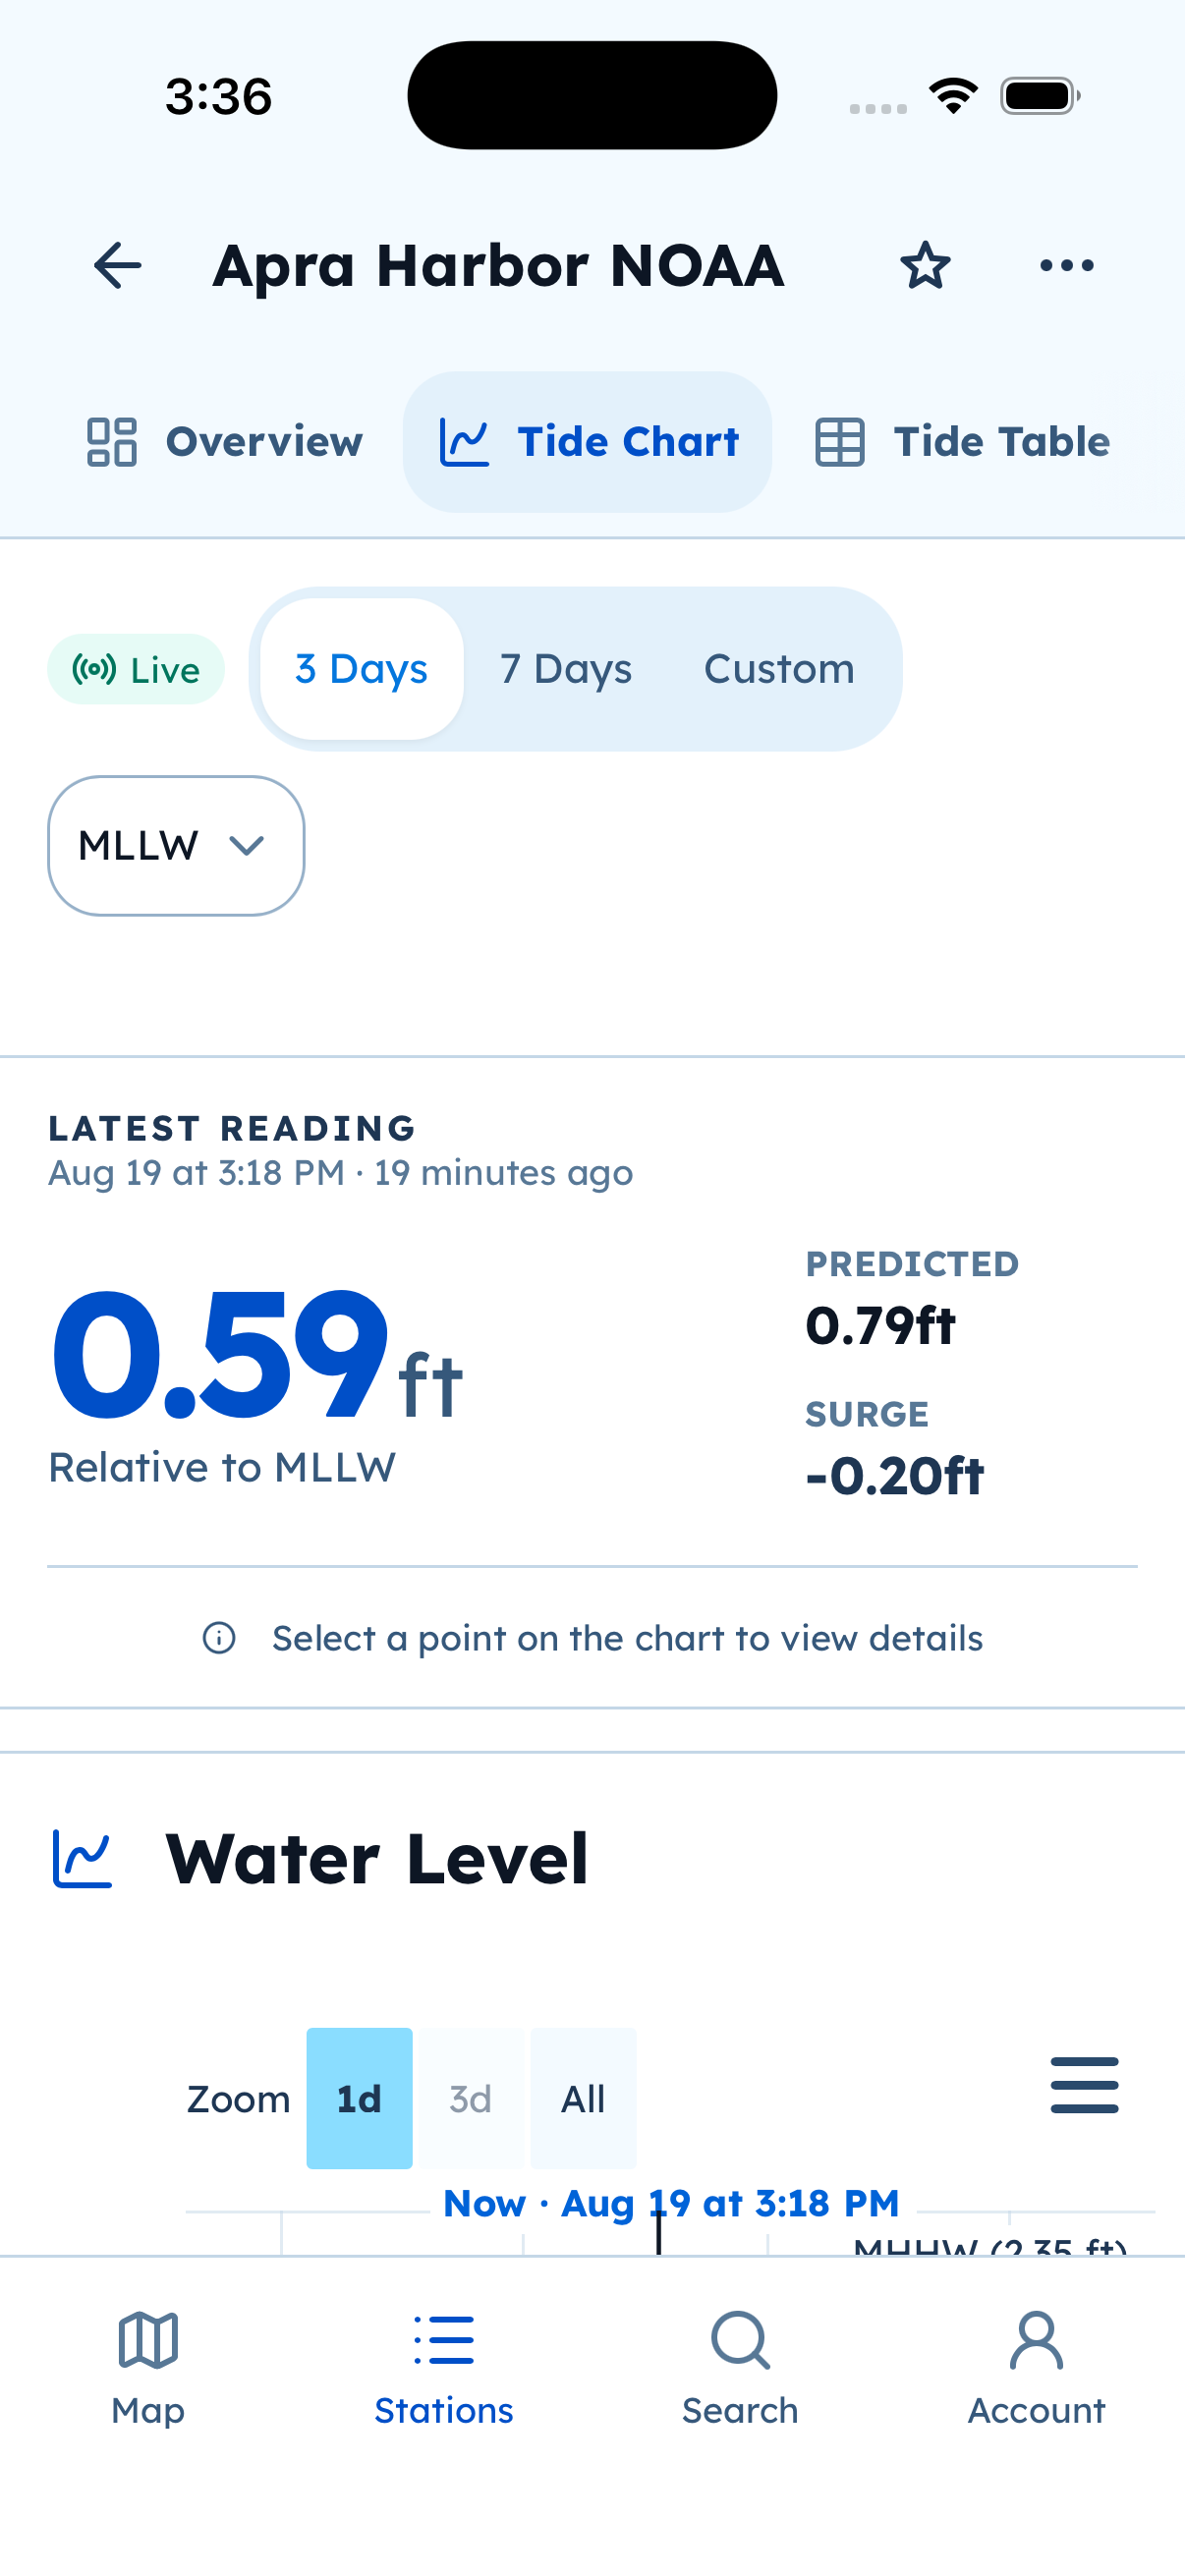
Tide Chart example: MLLW, a 3-day range, predicted vs surge. Exact traces depend on the station.
What you can do
- Change the visible range with the range control (phones include a compact navigator).
- Expand the chart in the app and share a PNG or JPEG of what you see.
- Observed and predicted traces can disagree when wind, surge, ice, or local effects move the water. That is expected. Typical NOAA-only tide apps never show you that gap. See Not an official NOAA app.
- When a station has measured bottom and bridge datums, those can appear on the chart so you can read depth and clearance — not only MLLW. Sentient Things stations have this today; NOAA, SECOORA, NERACOOS, and USGS are getting it too. See datums.
Charts are available without signing in.