Read a station
Station overview
The Overview page sums up a station, with the latest water level, the next high and low tide, weather, and the station's details and datums.
Opening a station shows its Overview. The tabs across the top lead to the other pages: Tide Chart, Tide Table, Tide Calendar, and, where the station has them, Weather and Alerts.
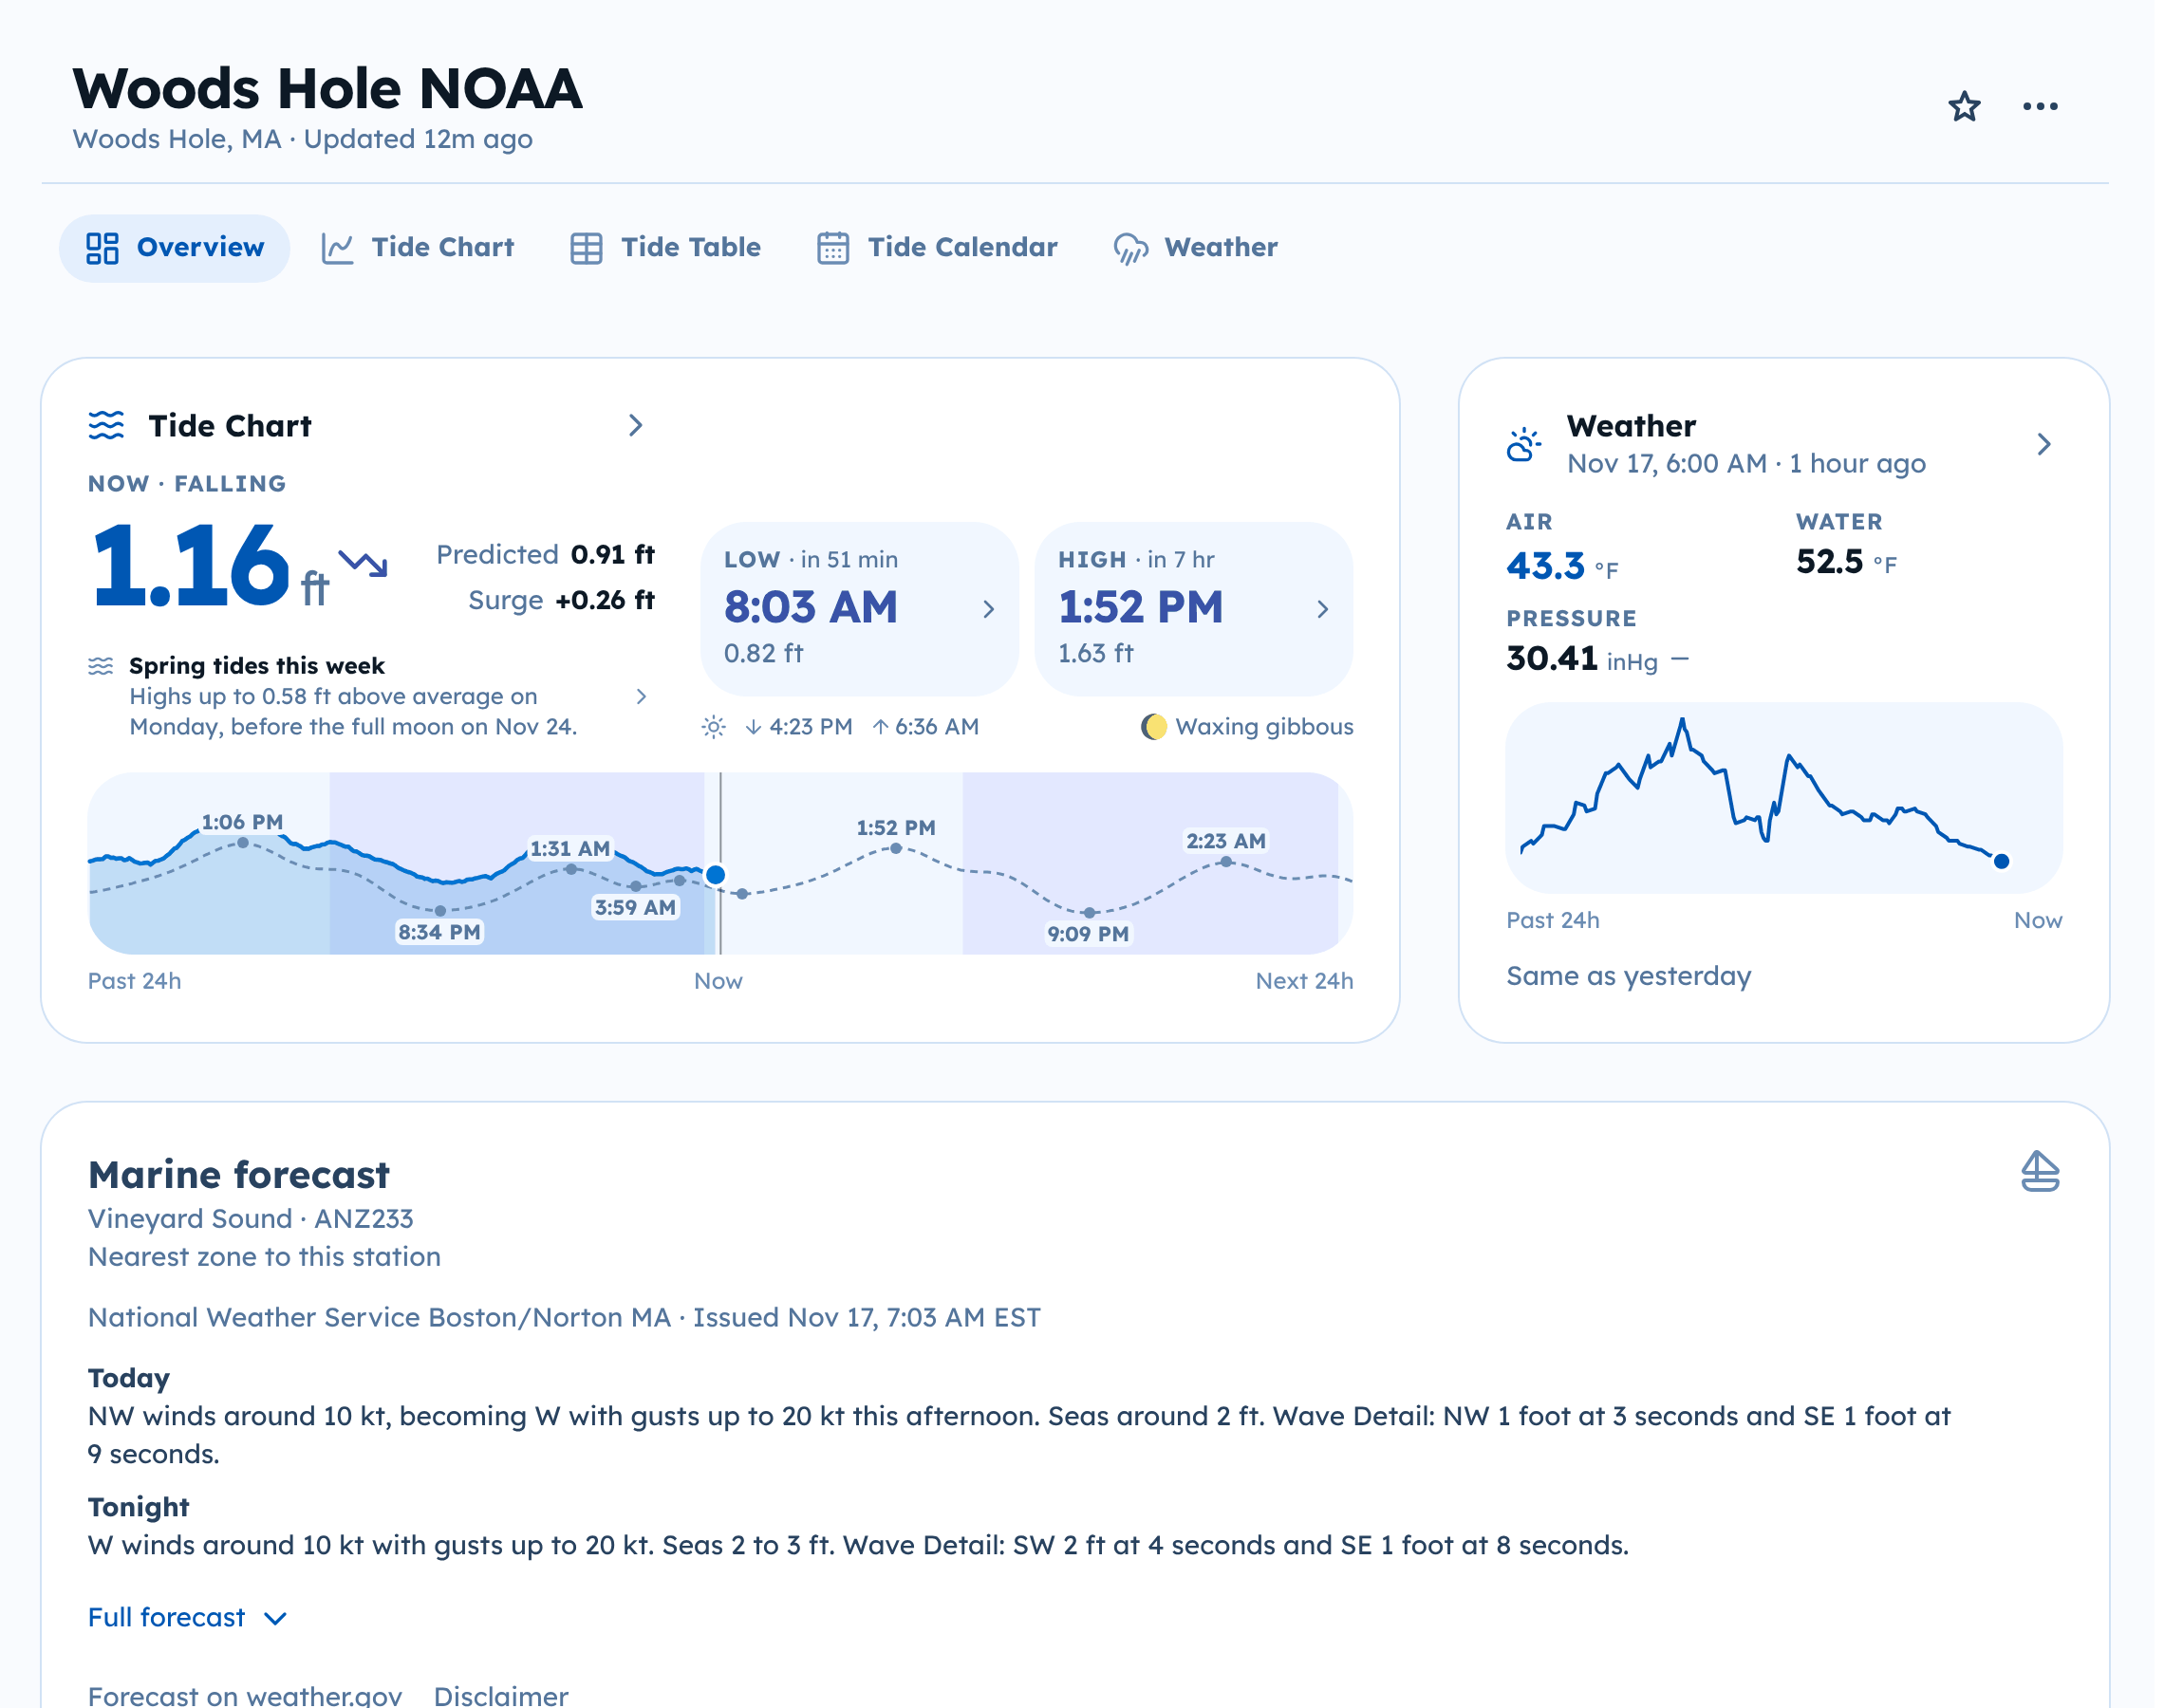
Tide Chart card
- The large number is the latest water level, with an arrow for rising or falling. Latest shows when it was measured; it says Now when the reading is current.
- Predicted is the tide prediction for the same moment. Surge is the difference between the two. See Observed and predicted water levels.
- The small chart covers the past 24 hours and the next 24 hours.
- The next high and low tide show their time and height, with sunrise, sunset, and the moon phase underneath.
- In a week of spring tides, Spring tides this week says how far the highest high will be above average, and when. Select it to open the Tide Table on that day.
Select the card to open the full Tide Chart.
Other cards
Depending on the station, the Overview can also show:
- Weather: air and water temperature, pressure, and more. See Weather.
- Marine forecast: the National Weather Service forecast for the marine zone nearest the station, shown as issued, with any marine warnings for that zone. Select Full forecast for the later periods, or Forecast on weather.gov to read it at the source.
- Health: for Sentient Things gauges, whether the gauge is reporting, with its battery and signal.
- Tide Records: the highest and lowest water levels the gauge has measured.
- Details: location, who provides the data and predictions, the type of station, and when its records start.
- Reference Datums: the datums this station has. See Units and datums.
A notice from the station's operator, for example about maintenance, can appear at the top of the station page.
The line at the bottom of every station page names the data sources and carries the disclaimer.