Read a station
Tide chart
The Tide Chart shows measured and predicted water levels over time, with the surge between them. Zoom, compare stations, and print or download the chart.
The Tide Chart tab plots the water level at a station over time.
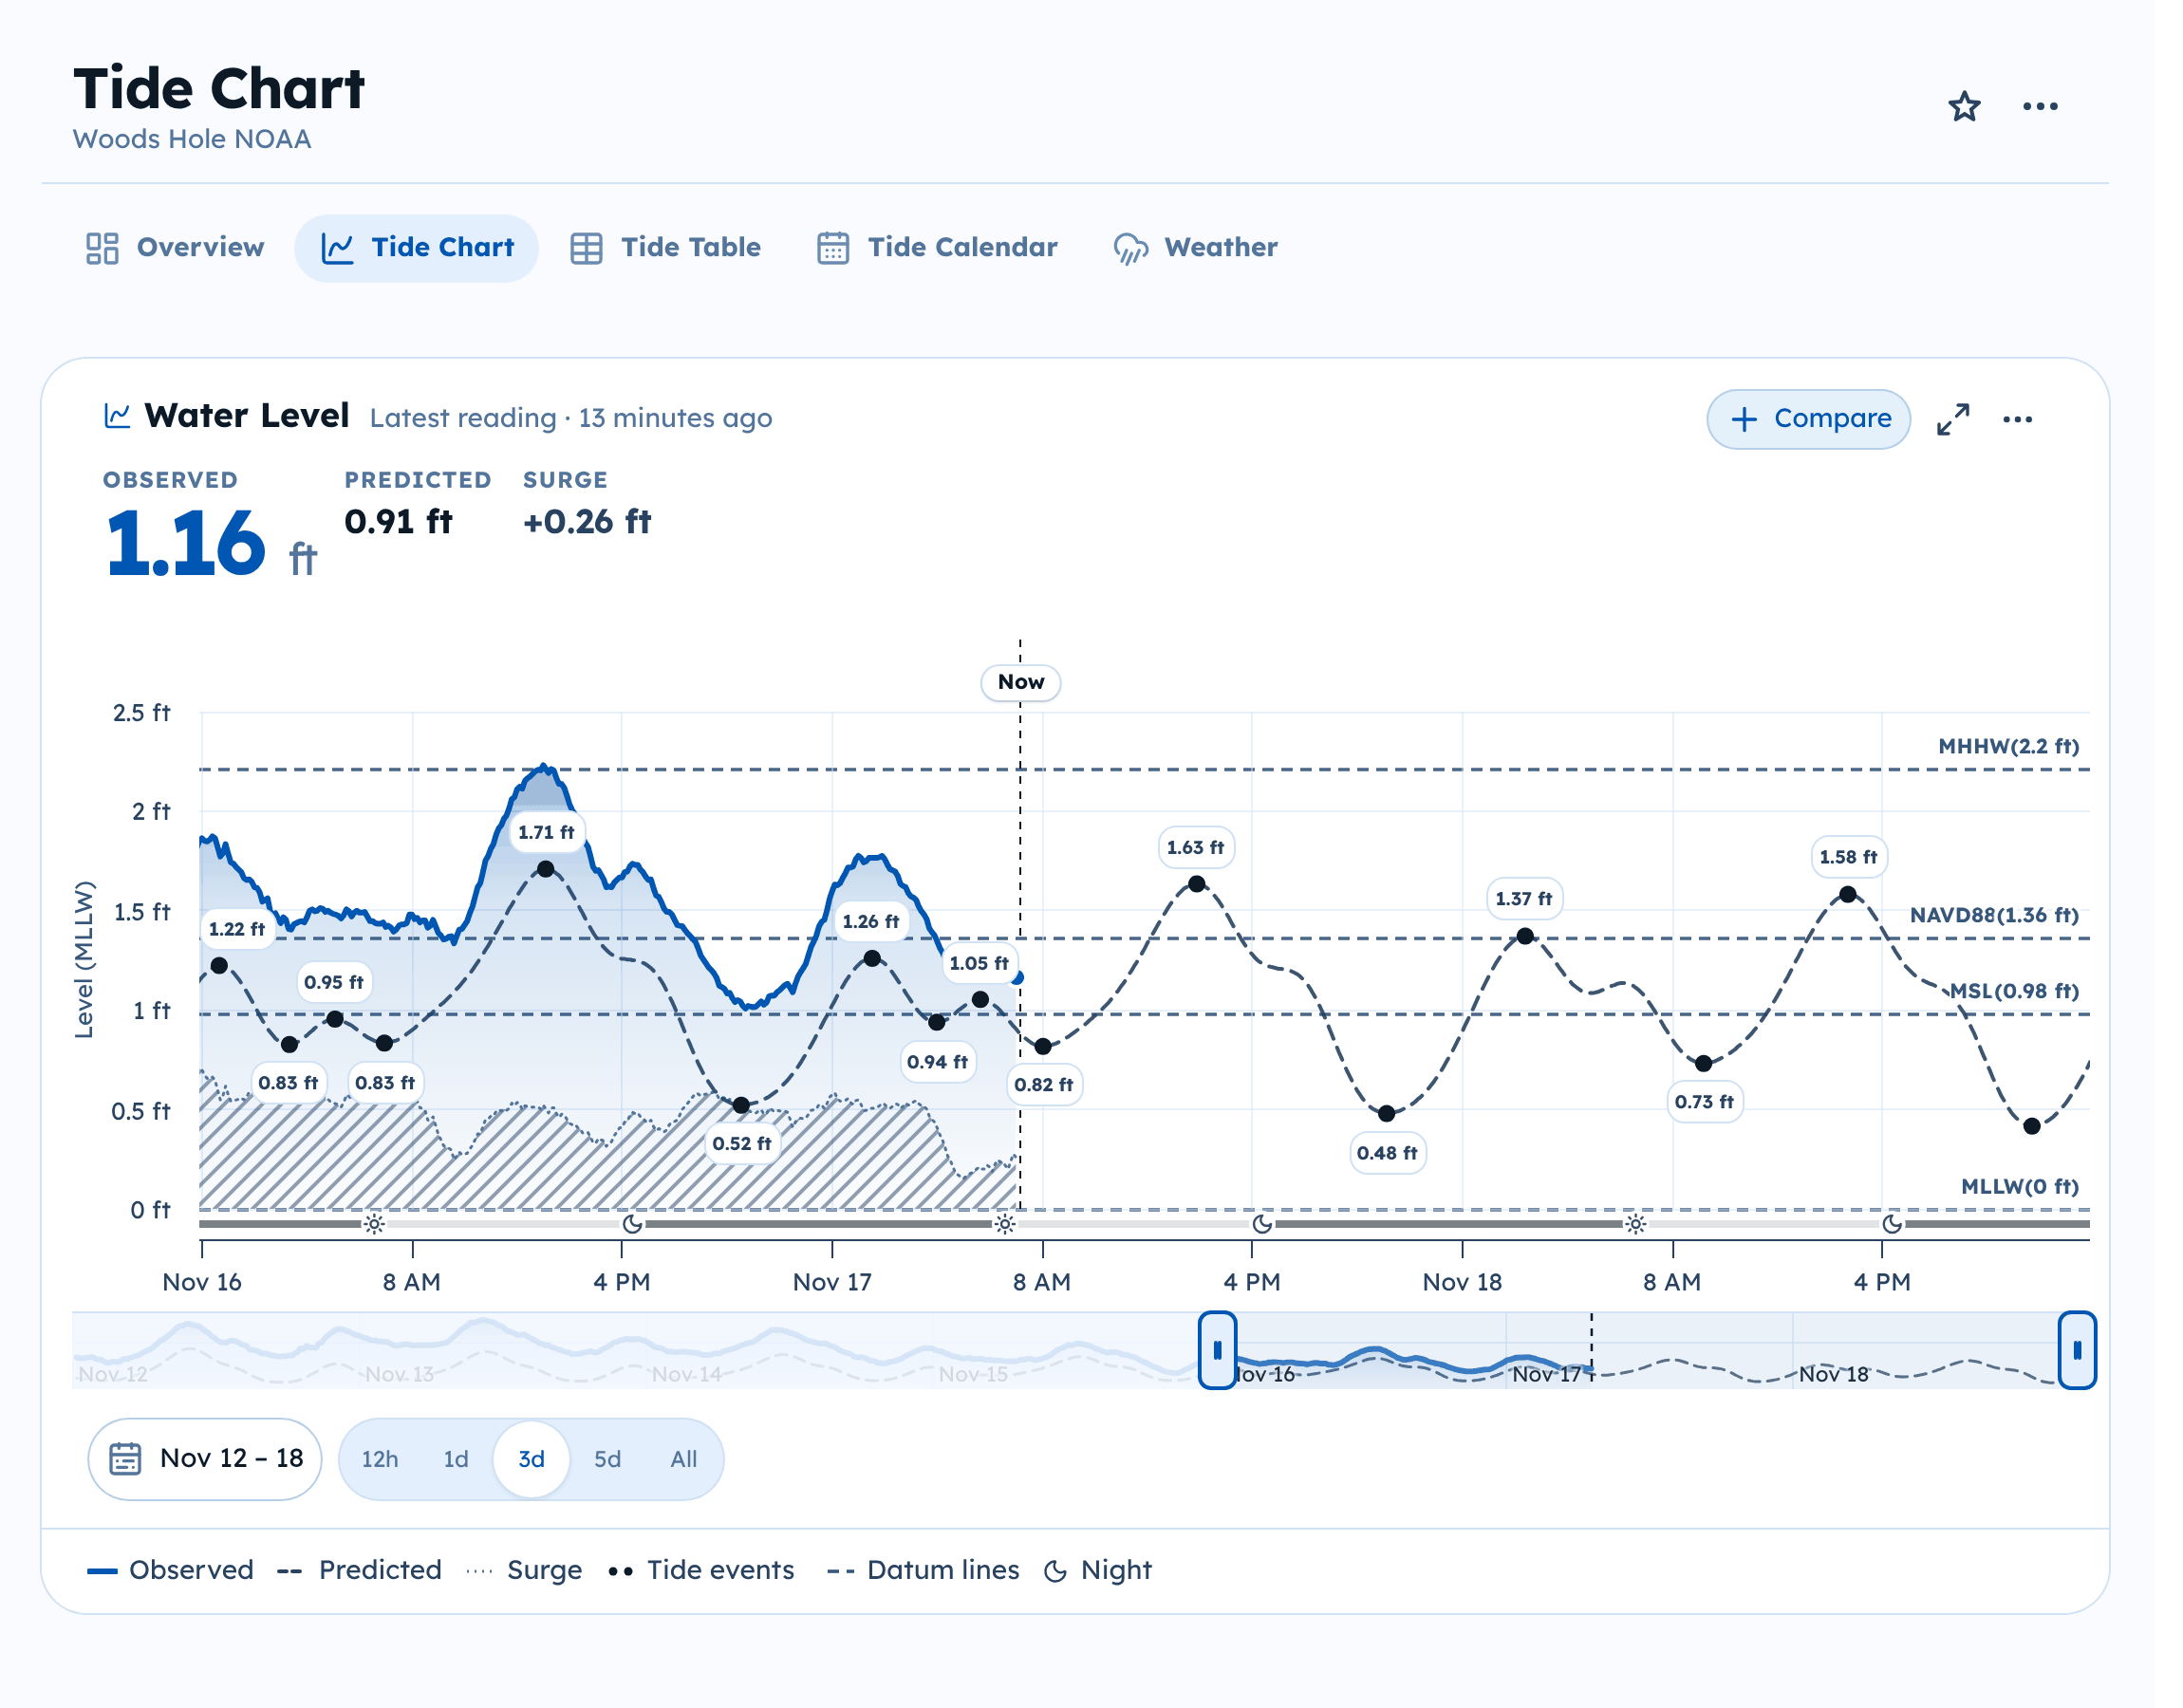
Read the chart
- Observed is what the gauge measured.
- Predicted is the tide prediction.
- Surge is the difference between them.
- Tide events mark each predicted high and low.
- Datum lines mark the station's datums, such as MLLW and MHHW.
- Night shades the hours between sunset and sunrise in the strip under the chart.
Use the items under the chart to show or hide each one. Hover over the chart to read the values at any moment. The Now line marks the current time; Latest marks the newest reading.
Heights are shown above the reference datum named on the axis, usually MLLW. See Units and datums.
Change the time range
- Choose 12h, 1d, 3d, 5d, or All to zoom.
- Drag the handles on the small chart underneath to pick any window.
- Select the date range to pick exact dates.
Compare stations
Select Compare to add other stations to the same chart, for example to see how the tide moves up a river.
Full screen, print, and download
- Select the full screen button to make the chart fill the window.
- Open the … menu on the chart to Print chart, Download PNG, or Download JPEG. Downloaded images include the data credits and the disclaimer.